The 2026 Ocean Freight Explodes: Why Shipping from China is Costing a Fortune Right Now and How to Protect Your Margins
If your business relies on importing from China, opening your freight invoices lately has probably felt like reading a horror script.
Over the past few weeks, global supply chains have been hit by a massive wave of panic. Your social media feeds are likely flooded with frantic warnings from logistics providers:
“Europe routes have completely boiled over!” “Securing a single container slot to the US is like winning the lottery!” “40HQ container spot rates are skyrocketing toward $7,000!” “Carriers are slapping on $2,000 Peak Season Surcharges per box with zero notice!”
This isn’t just standard carrier posturing or temporary market friction. As of late May 2026, the Shanghai Containerized Freight Index (SCFI) has marched upward for five consecutive weeks, breaching the 2,218-point mark—a brutal 70% surge from the market lows we saw in February.
For hundreds of e-commerce brands, B2B procurement managers, and industrial wholesalers, the reality is stark: the cost of shipping from China is rapidly catching up to, or even exceeding, the actual manufacturing value of the goods inside the container.
If you are trying to calculate your landed costs for Q3 and Q4, running on outdated 2025 logistics data will break your business model. Let’s look at the raw mechanics behind this sudden capacity crunch, map out the actual spot rates across major trade lanes, and look at the strategic plays you need to execute immediately to keep your cargo moving without going broke.
The Four Forces Driving the 2026 China Freight Spike
This sudden rate explosion didn’t happen in a vacuum. It is the result of a perfect systemic storm: geopolitical detours, an artificially compressed peak season, soaring fuel sheets, and aggressive capacity manipulation by the major carrier alliances.
1. The Cape of Good Hope Detour: The 10-Day Capacity Black Hole
The prolonged Red Sea crisis remains the single most destructive structural driver of modern ocean freight inflation. The Suez Canal used to act as the primary maritime highway connecting manufacturing hubs like Ningbo and Shanghai to European and Mediterranean entry ports.
Because over 90% of container lines still cannot safely cross the Bab al-Mandab strait due to ongoing regional volatility, ships are forced to take the long way around Africa’s Cape of Good Hope.
The mathematical toll of this detour on global logistics is devastating:
- Extended Transit Times: The African detour adds 10 to 14 days of pure sailing time to a standard voyage. This means a vessel that used to handle a clean monthly round-trip is now lagging behind schedule, effectively deleting one entire sailing per quarter from the global grid.
- Effective Capacity Slashing: Suez Canal transit volumes have plummeted by nearly 40%. When you multiply those extra weeks at sea across hundreds of mega-max container ships, the detour actively neutralizes 15% to 20% of global effective shipping capacity. The ships still exist, but they are trapped at sea longer, meaning fewer empty containers return to China to pick up your next order.
- The Cost Compounding Effect: Running a 24,000 TEU vessel for an extra two weeks requires a staggering amount of extra bunker fuel and crew overhead, immediately adding hundreds of thousands of dollars in baseline operating costs per voyage.
2. The Artificial May Peak Season + The Sourcing Reshoring Rush
Traditionally, the peak season for sea freight from China begins to brew in late June and hits full stride between August and October. In 2026, that calendar was completely rewritten. The peak season erupted in the first week of May due to a massive confluence of buying behavior.
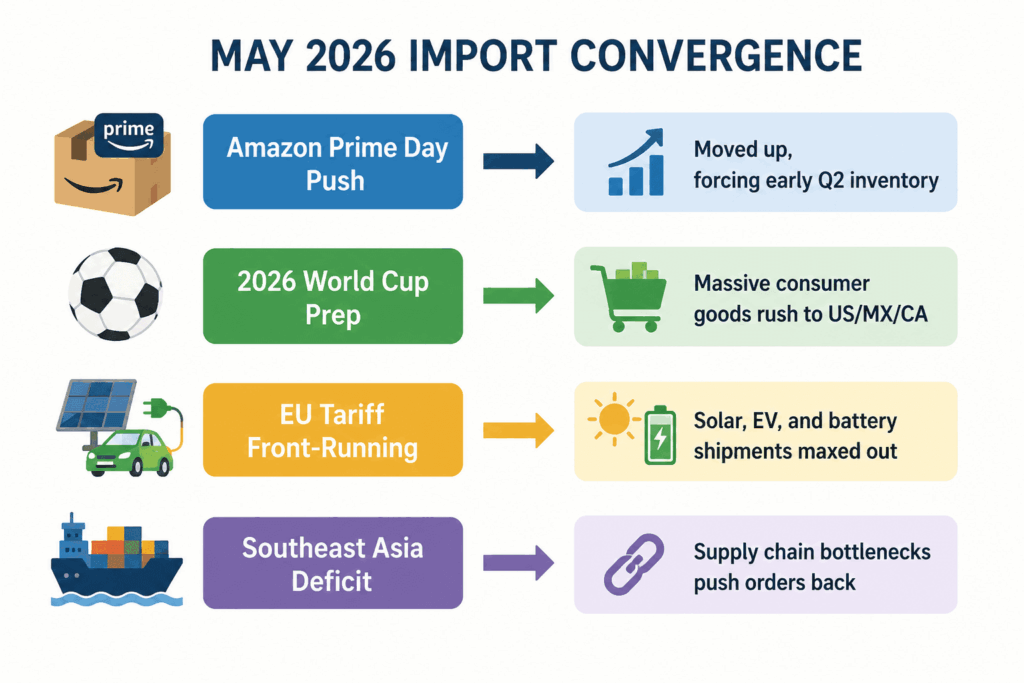
- The Retail Timeline Shift: With major global e-commerce platforms shifting their promotional calendars earlier into summer, cross-border sellers were forced to pull their inventory procurement plans forward.
- The 2026 World Cup Factor: With the United States, Canada, and Mexico hosting the upcoming World Cup tournament, massive institutional orders for event merchandise, promotional apparel, and consumer electronics flooded the market early to guarantee arrival before North American domestic rail networks jam up.
- The European Green Rush: European buyers of photovoltaic (PV) modules, lithium batteries, and electric vehicles front-loaded their order books to beat impending regulatory and tariff changes, locking up massive blocks of specialized container space in East China ports.
- The Failure of Southeast Asian Alternatives: Over the past two years, many Western brands attempted to mitigate risk by diversifying their sourcing to Vietnam, Malaysia, and India. However, under-developed infrastructure and severe container equipment deficits in these secondary countries have caused massive export delays. Desperate to keep store shelves full, hundreds of corporations have redirected their procurement back to mainland China, causing a sudden, concentrated surge in container demand across Shenzhen, Shanghai, and Qingdao.
3. Skyrocketing Bunker Fuel Costs
Even if demand softened slightly, the structural price floors for a 40ft container from China have shifted fundamentally due to upstream energy costs and strict capacity management by the world’s leading shipping cartels.
The 69% Fuel Sheet Surge
International maritime fuel markets have experienced relentless upward volatility. The spot price for Very-Low-Sulfur Fuel Oil (VLSFO)—mandatory for compliance with environmental emissions caps—has jumped a staggering 69% year-on-year. High-Sulfur Fuel Oil (HSFO), utilized by vessels equipped with exhaust scrubbers, followed closely with a 61% increase.
Carriers are not absorbing these operating losses. Instead, they are passing them directly down to the importer through aggressively scaled Bunker Adjustment Factors (BAF) and emergency Peak Season Surcharges (PSS). On transpacific lanes, these surcharges alone have tacked on up to $2,000 per 40HQ container.
4. Structural Carrier Collusion
The Alliance Blank Sailing Strategy
The mega-alliances controlling global maritime trade have perfected the art of “capacity rationing.” Realizing they hold absolute pricing power in a tight market, carriers implemented strategic blank sailings (canceling scheduled vessel loops) throughout April and May.
By pulling seven to eight major container loops out of the East China region, carriers artificially choked the supply of available slots. Because lines have more cargo waiting on the docks than they can physically fit on their decks, they have zero economic incentive to lower rates. Instead, they are letting desperate freight forwarders bid against one another, pushing the spot market higher week after week.
Route Breakdown: The May 2026 Reality Check
To give you an accurate baseline for your freight budgeting, here is how spot market container prices are shaking out across major global shipping lanes as we head toward June 2026.
| Destination Region | Key Gateway Ports | Average Spot Rate (Per FEU/40HQ) | Month-on-Month Increase | Equipment Availability Status |
| Mediterranean / Red Sea | Genoa, Valencia, Aqaba | $5,500 | +83% | Critical Shortage (No 40HQs) |
| Northern Europe | Rotterdam, Hamburg, Felixstowe | $2,800 | +24.4% | Tight (2-Week Booking Delay) |
| US West Coast | Los Angeles, Long Beach, Oakland | $3,332 | +21.3% | Moderate (Severe Port Congestion) |
| US East Coast | New York, Savannah, Houston | $5,800 – $6,000 | +15.7% | Tight (Chassis Shortages) |
These numbers represent the base ocean rates. What is catching many small-to-medium enterprises (SMEs) off guard are the secondary line items appearing on their freight invoices. Bunker Adjustment Factors (BAF) are climbing rapidly to offset a year-on-year increase in very-low-sulfur fuel oil costs, and carriers are holding firm on Peak Season Surcharges (PSS), which are adding anywhere from $500 to $2,000 per container depending on the carrier’s specific allotment tier.
The Downstream Impact: Rollovers and Port Realities
When ocean freight rates from China spike this aggressively, it triggers a chain reaction across major loading ports like Shanghai, Ningbo-Zhoushan, and Shenzhen.
What is a Cargo Rollover? > A rollover happens when a shipping line cancels a sailing or overbooks a vessel, pushing your confirmed container booking to the following week’s vessel. In the current high-rate environment, low-contract rate containers are highly susceptible to being rolled in favor of spot cargo paying top-dollar surcharges.
While general port visibility reports indicate that global berth delays are relatively stable compared to pandemic-era gridlocks, the internal infrastructure within Chinese hubs is highly strained. Container yards are packed, and booking lead times have stretched from a standard 7 days out to a mandatory 14 to 21 days pre-sailing notification window. If you are not booking your space at least three weeks before your cargo is ready at the factory floor, you are already too late.
Tactical Survival Blueprint: How Importers Can Manage the Surge
If your business relies heavily on importing from China, you cannot simply halt operations and wait for rates to drop. Supply chain continuity is your lifeblood. Instead, you must shift from a passive procurement mindset to an active, tactical logistics strategy.
Here are the three proven strategies we are implementing for our elite import partners at Kisun Shipping to protect their product margins.
1. The Volume Pivot: Optimize Cargo via LCL Consolidation
While Full Container Load (FCL) spot rates are behaving like volatile tech stocks, Less than Container Load (LCL) pricing has shown remarkable structural stability through mid-May. According to global freight market indices, LCL consolidation rates have held steady at around $110 per CBM on core lanes.
If your shipment volume sits anywhere under 15 to 20 CBM, stop fighting the crowd for a full 40HQ container. By utilizing LCL, you only pay for the exact volume you occupy. Your freight forwarder China handles the consolidation at the origin hub, allowing you to bypass the massive capital layout of booking a highly surcharged full container. It keeps your cash flow nimble and gets your products onto the water faster.
To learn more about how to properly structure your container allocation and choose between volume modes, check out our baseline guide on sea freight from China, which breaks down the cost-per-CBM break-even points for global trade lanes.
2. Lock In Rate Validity with Rigid Protection Clauses
In a volatile market, a quote that is valid for “72 hours” is a liability. When requesting a quote for shipping from China to the US or Europe, pressure your forwarder to secure a 2-to-3 week validity window with explicit caps on General Rate Increases (GRIs) and Bunker Adjustment Factors.
If a forwarder hands you a dirt-cheap price but leaves the surcharges open-ended, you are highly likely to receive an adjusted invoice the moment your container hits the origin gate. Insist on all-in transparency. Know exactly what your landed cost will look like before the truck pulls away from your supplier’s loading dock.
3. Implement Intermodal and Gateway Diversion
If your standard supply chain default is to ship directly from China into major West Coast hubs like Los Angeles or Long Beach, it is time to pressure-test alternative routings. Secondary gateways and intermodal connections are showing healthier congestion profiles.
For European Trade: If standard North Europe lanes are entirely gridlocked, look into intermodal air-sea configurations or alternative Mediterranean feeder services that route cargo into Southern European entry points, cutting down on the long northern transit loop.
For North American Trade: Utilizing alternative entry ports like Houston, Virginia, or Pacific Northwest gateways like Vancouver can sometimes allow you to bypass the heaviest vessel backlogs and secure space on secondary carrier loops.
Looking Ahead: Will Rates Ease Up in 2026?
According to historical trade lane analysis and predictive maritime capacity modeling, the current elevated freight environment will highly likely sustain its upward momentum through June and July of 2026. The combination of early retail inventory stocking and the ongoing African rerouting structural deficit means supply and demand will remain tightly locked for the next 60 to 90 days.
We anticipate the market will find a more stable equilibrium after August, as the initial wave of front-loaded e-commerce inventory clears out and new container vessel deliveries slightly ease the equipment shortages in East China.
Until then, survival comes down to rigorous cost planning, absolute data compliance, and choosing a logistics partner who gives you transparent data rather than cheap, unfillable promises.
Don’t let unpredictable ocean spot markets sink your business margins this year. Connect with a Kisun Shipping Allocation Expert Today to secure guaranteed equipment allocation for your next production run, or check out our comprehensive blueprint on How to Ship from China to Amazon FBA to keep your e-commerce replenishment loops running seamlessly despite global delays.

China Logistics Expert
About the Author
Katherine Kang is a China-based logistics consultant with over 11 years of experience in international trade and freight forwarding. Specializing in helping SMEs import from China to the USA, Canada, and Europe, she focuses on compliant, cost-effective solutions to avoid delays, tariffs, and hidden fees. From anti-dumping guidance to CNY planning, Katherine has managed hundreds of shipments, saving clients 15-30% on average.
Connect with Katherine on LinkedIn or contact Kisun Shipping for a free import consultation.